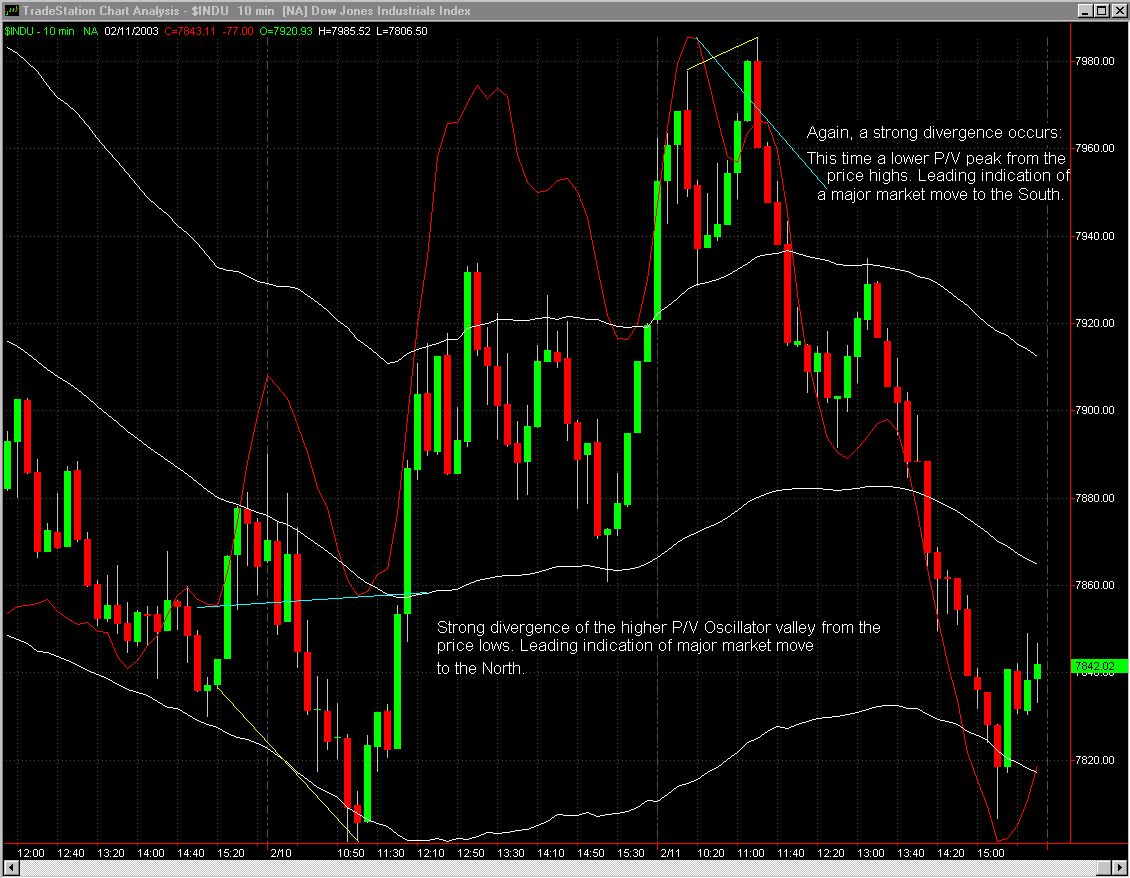
The KC Collection captures entire trend moves, in both directions.
One after another....

Trade Analysis:
The Market: We chose a recent Dow Jones Industrial Average (DJIA) chart to illustrate how effectively and powerfully the KC Collection elements work in intermarket analysis.
For major trend moves, there is a clear and direct relationship between the DJIA and the index futures contracts (E-Mini S&P, full S&P, E-Mini Nasdaq, etc).
When we see powerful divergence signals like those shown above, it's all the trade confirmation we need to trade the index futures markets. We know that the indexes will be moving in close parallel with the broader DJIA market, and this is going to take us on a very enjoyable and profitable ride. Let's take a look at what happened here:
 2/10/03, 11:00AM: The P/V Oscillator (the dark red colored indicator) indicates strong bullish divergence at the very beginning of the North move, when the price is right at the bottom Keltner Pro band (white band). Remember that this outer Keltner band is the perfect place (highly oversold market) for any major reversal to the North.
How to read the divergence: The bullish divergence is indicated by the higher valley on the P/V Oscillator (see the cyan colored line connecting the P/V valleys and heading upwards) diverging from the corresponding lower low on the price (see the yellow colored line connecting the respective price lows and heading downwards). This clearly shows that the market is going to move strongly in the upward-moving direction of the leading indicator, the P/V Oscillator.
And immediately after we got this indication, the market rockets to the North, over 180 points on the DOW! If you check any of the index futures markets at the above date and time, you will find they all rocketed Northward in a huge way, beginning at the same moment.
 2/11/03, 11:20AM: It's a mirror image the next day! But this time the major move happens even more intensely to the South, with bearish divergence.
Reading it: Note how the cyan line points in a downward direction, connecting the P/V Oscillator's higher peak to the lower peak (peaks are the red lines). This shows us in advance where the market is headed. See how strongly that diverges from the price, indicated by the upward-directed yellow line which connects the lower price high to the higher price high.
And where did that divergence happen? It happened with the price way above the top Keltner Pro band, a place representing an extremely overbought market condition. This market is looking for any reason to sell off at this point, and the P/V Oscillator tells us exactly when.
Immediately following this extreme bearish divergence indication, the market plunges another 180 points in just a little over 3.5 hours. And like before, the index futures markets similarly made huge moves South, directly in tandem with the larger DJIA market.
Conclusion:
Using just two elements of the KC Collection (the Keltner Pro and P/V Oscillator), we are able to get crystal clear indications of major market reversals -- at the very beginnings of the moves. This is what many say "can't be done." Well, this is what the KC Collection does on a regular basis!
 ORDER NOW!
 You just have to see this...
© 1995-2005 The Futures Group, Inc. All Rights Reserved.


